Tail currents in the Vandenberg and Bezanilla (1991) model (VB, black traces) and the Hodgkin and Huxley (1952d) model (HH, blue traces) of the sodium current in squid giant axon in response to the voltage-clamp protocol shown at the base, where the final testing potential could be (a) -98mV or (b) -58mV. During the testing potential, the tail currents show a noticeably slower rate of decay in the VB model than in the HH model. To assist comparison, the conductance in the VB model was scaled so as to make the current just before the tail current the same as in the HH model. Also, a quasi-ohmic I-V characteristic with the same ENa as the HH model was used rather than the GHK I-V characteristic used in the VB model. This does not affect the time constants of the currents, since the voltage during each step is constant.
Figure 5.13
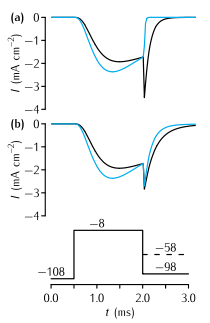
Tail currents in the Vandenberg and Bezanilla (1991) model and the Hodgkin and Huxley (1952d) model
Simulation environment:
Notes
This simulation contains two separate neurons, one containing VB model sodium channels and one containing HH model sodium channels. The parameters of each neuron are described in the windows entitled somavb and somahh. Each neuron has a voltage clamp electrode inserted.
To reproduce panel (a):
- In both I/V Clamp Electrode windows click on the checkbox next to VClamp
- In the Run Control window click on Init & Run
- The currents shown in Fig 5.13a should appear in the middle graph on the right. Additionally, the upper graph shows the states of the VB channel (see Fig 5.12) and the lower graph shows the conductance of the two types of channels
To reproduce panel (b)
- In both I/V Clamp Electrode windows in the Return Level section change the amplituce to -58mV
- In the Run Control window click on Init & Run
Download: