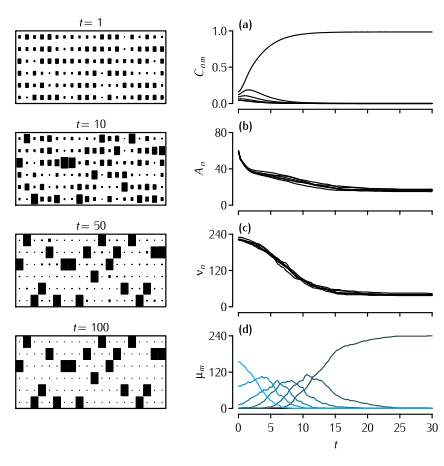
The Dual Constraint model applied to the mouse lumbrical muscle. Left hand column shows the development through time of the pattern of connectivity as displayed in a connection matrix Cnm. The area of each square indicates the strength of that element of Cnm. For clarity, only twenty of the 240 endplates are shown. Right hand column shows the development through time of four different quantities. (a) The value of Cn1, i.e. the strength of connections from each of the six axons competing for the first muscle fibre (Equation 10.13). (b) The value of the amount of available presynaptic resource An at each of the six axons (Figure 10.14). (c) The motor unit size νn of each of the six axons. (d) The number of endplates μ which are singly, or multiply innervated. The colour of the line indicates the level of multiple innervation, ranging from 1 (black) to 6 (blue). Parameters: N = 6, M = 240, A0 = 80, B0 = 1, α = 45, β = 0.4, γ = 3, δ = 2. Only terminals larger than θ = 0.01 were considered as being viable. Terminals that were smaller than this value were regarded as not contributing to νn and therefore did not receive a supply of A.